The Auto Page busts a good few South African stolen car myths
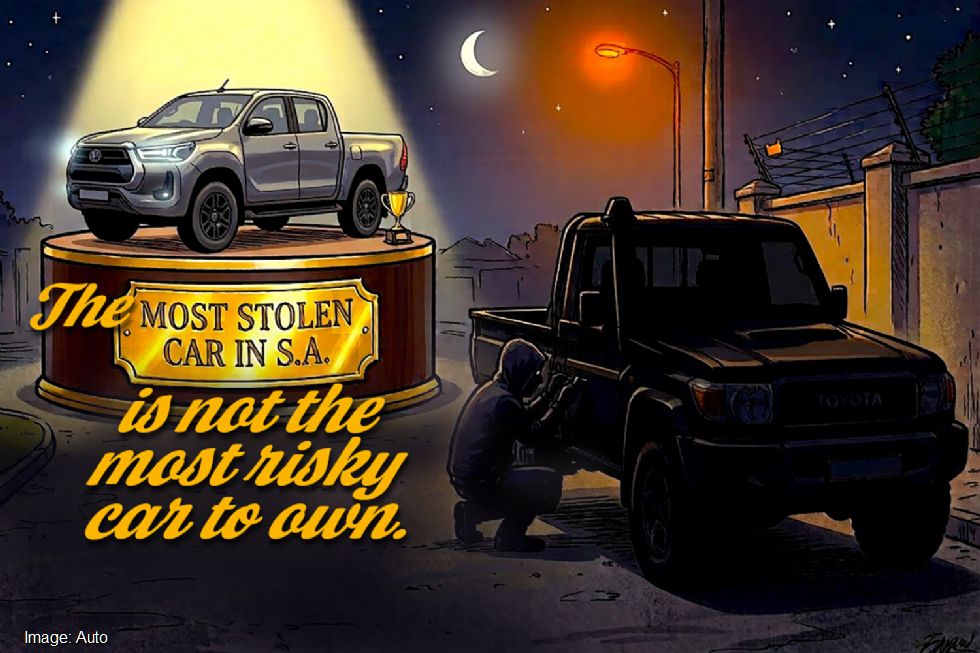
So you think the Toyota Hilux is South Africa’s most stolen car? Think again! When it comes to real risk, you have a far better chance of buying six other cars that have a much higher likelihood of being nicked.
While stolen car statistics are traditionally based on pure, raw numbers stolen, they consistently fail to factor in how many of those cars are actually sold. So while SA’s biggest-selling bakkie is indeed its most stolen vehicle in straight volume, it actually lines up as only the seventh most stolen vehicle in terms of cars stolen versus that model sold. Hold onto your hats. This one’s an absolute shocker.
ALSO IN THE AUTO SA CAR THEFT REPORT
- Discover why the cars most at risk to be stolen, are not quite what you think they are
- Understand how your popular car may be saddled with unfounded insurance penalties
- Read why more common cars on the road are not necessarily the biggest theft risks
The Great Insurance Illusion
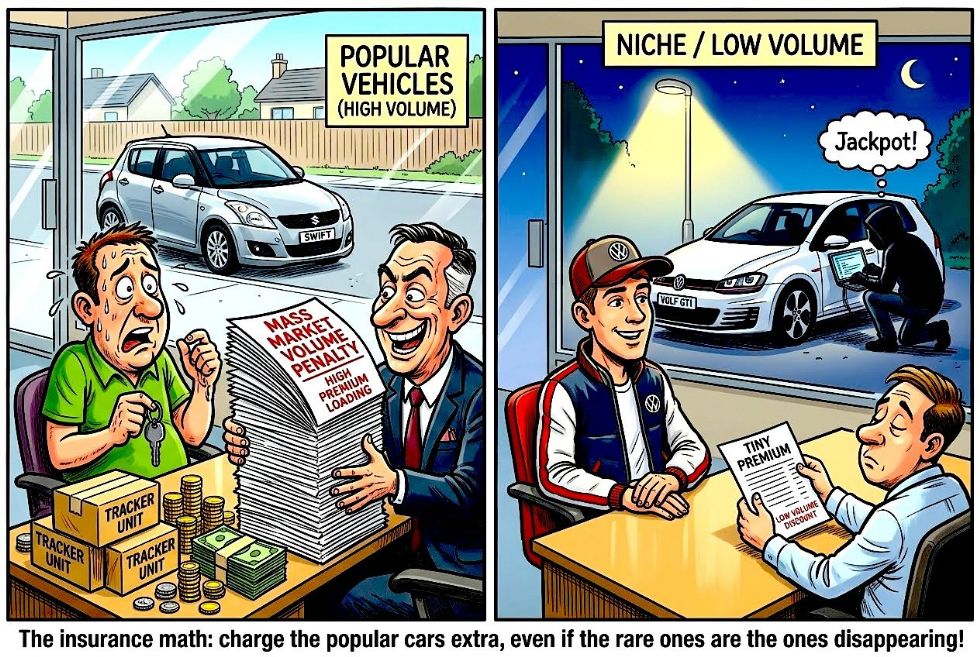
Every year, tracking outfits, security agencies, and police releases drop dramatic bar charts that send motorists into a blind panic. And right on cue, the short-term insurance industry pounces. Actuaries and underwriters love straight volumes because big, scary numbers provide the ultimate excuse to hike premiums, load your monthly excess, and demand two or three tracking units on vehicles that simply happen to be national best-sellers.
It is a clever illusion, but a deeply flawed one. If you have 170,000 Hiluxes on the road over a five-year cycle and 34,000 get stolen, that sounds catastrophic in isolation. But if an automaker sells only 16,000 units of a specialist off-roader over that same period and syndicates pinch 5,500 of them, your personal mathematical odds of being targeted in the smaller seller are exponentially higher. By looking only at raw volume, insurers punish popularity while disguising where the real per-unit risk lies.
To cut through the fog, Auto crunched the numbers over South Africa's standard five-year vehicle ownership cycle. We took cumulative sales over five years, matched them against five-year theft and hijacking statistics across tracking and crime data, and calculated the real acid test: an Index of vehicles stolen per 100 units sold. The result turns South African car theft wisdom right on its head.
Looking strictly at raw, unadjusted five-year theft and hijacking volumes based on insurance industry data over that period, the usual suspects immediately hog the limelight. Because Toyota and Volkswagen command colossal chunks of South Africa's vehicle population, their workhorses and runabouts naturally occupy the sharp end of straight syndicate losses.
SOUTH AFRICAN CAR THEFT: CARS MOST STOLEN
Rank	Make & Model  Estimated 5-Year Thefts
 1 	Toyota Hilux 		       34,500
 2	Volkswagen Polo Vivo           23,500
 3 	Volkswagen Polo Hatch          18,000
 4  	Ford Ranger  		       15,000
 5 	Toyota HiAce Ses'fikile        14,000
 6 	Toyota Fortuner  	       13,000
 7 	Nissan NP200  	        	9,750
 8 	Isuzu D-Max 	  		8,750
 9 	Toyota Corolla Cross    	7,000
10 	Toyota Land Cruiser 70 (79) 	5,600

Busting the Myth: Notice how the top of this list
mirror's Naamsa's top-sellers almost line-for-line?
But does that alone make these cars more risky
to own? Keep reading to learn the truth…

11 	Toyota Starlet 	        	4,300
12 	Hyundai Grand i10 		4,000
13 	Toyota RAV4 			3,300
14 	Suzuki Swift 			2,850
15 	Kia Picanto 			2,500
16 	Renault Kwid 			2,400
17 	Toyota Urban Cruiser    	2,350
18 	Hyundai i20 			2,250
19 	Mahindra Pik Up 		2,200
20 	Volkswagen Polo Sedan   	2,150
21 	Nissan Navara 	        	2,100
22 	BMW 3 Series 	        	1,950
23 	Toyota Corolla Quest		1,750
24 	Nissan Magnite 		        1,700
25 	Isuzu MU-X 			1,650

Hidden Perils: How many cars in this neck of the
woods are simply less stolen because fewer of them
are sold in the first place? Scroll down to the
next table for a shock revelation!

26 	Volkswagen T-Cross 		1,600
27 	Toyota Land Cruiser Prado	1,550
28 	Haval Jolion			1,350
29 	Ford EcoSport 	 	        1,300
30 	Chery Tiggo 4 Pro		1,200
31 	Ford Everest 			1,100
32 	Kia Sonet 			1,100
33 	Renault Triber 	 	        1,050
34 	Renault Kiger 			1,000
35 	Toyota Rumion 	            	  950
36 	Suzuki S-Presso 		  950
37 	GWM P-Series 	        	  850
38 	Mercedes-Benz C-Class     	  800
39 	Suzuki Ertiga			  780
40 	Hyundai Tucson 	        	  620
41 	Suzuki Baleno 		          600
42 	Volkswagen Golf GTI/R   	  580
43 	Toyota Vitz 			  560
44 	Suzuki Fronx 			  420
45 	Haval H6 			  380
46 	Mazda CX-5 			  350
47 	Suzuki Jimny 			  290
48 	Chery Tiggo 7 Pro 		  260
49 	Toyota Starlet Cross 		  140
50 	Honda Fit / Jazz 		  130
The Acid Test: The 50-Car Risk Index
Now, let's inject reality into the equation. When you measure the number of vehicles stolen against the total new units sold over that identical five-year stretch, the leaderboard is completely rewritten. The true syndicate darlings emerge from the shadows.
Topping the real risk chart is the legendary Toyota Land Cruiser 70-Series LC79 pick-up, scoring an eye-watering theft index of 33.3 cars stolen for every 100 sold. It is followed by the Toyota Fortuner at 27.1 and the standard Volkswagen Polo hatch at 26.5. Your beloved Hilux? It drops down to seventh, sitting on an index of 20.1—neck and neck with its humble workhorse cousin, the Nissan NP200.
SOUTH AFRICAN CAR THEFT: CARS WITH HIGHEST RISK OF THEFT
Rank	Make & Model                     Sales  Thefts Thefts
                                                         /100
                                                        Sales
 1 	Toyota Land Cruiser 70 (79) 	16,800	 5,600 	 33.3
 2 	Toyota Fortuner 		48,000	13,000	 27.1
 3 	Volkswagen Polo Hatch   	68,000 	18,000	 26.5
 4 	Toyota Land Cruiser Prado 	 6,400 	 1,550 	 24.2
 5 	Nissan NP200 	        	47,000 	 9,750	 20.7
 6 	Volkswagen Polo Vivo           114,000 	23,500 	 20.6
 7 	Toyota Hilux 		       172,000 	34,500 	 20.1
 8 	Toyota HiAce Ses'fikile 	71,000 	14,000 	 19.7
 9 	Toyota RAV4  			18,500 	 3,300 	 17.8
10 	BMW 3 Series 	        	11,200 	 1,950 	 17.4

Not to what you expected? Well, cars stolen versus that model
sold is a very different truth to what the insurance industry
publishes and wants you to believe. But why? Read on!

11 	Ford Ranger		       111,000 	15,000	 13.5
12 	Toyota Corolla Quest    	13,500 	 1,750 	 13.0
13 	Volkswagen Polo Sedan   	18,000 	 2,150 	 11.9
14 	Isuzu MU-X 			14,000 	 1,650 	 11.8
15 	Toyota Corolla Cross    	65,000 	 7,000 	 10.8
16  	Isuzu D-Max 			87,000 	 8,750 	 10.1
17 	Hyundai Grand i10 		41,000 	 4,000 	  9.8
18 	Nissan Navara	        	22,500	 2,100	  9.3
19 	Kia Picanto	 		28,000 	 2,500    8.9
20 	Hyundai i20 			26,000	 2,250	  8.7
21 	Renault Kwid			29,500 	 2,400 	  8.1
22 	Ford Everest			14,200 	 1,100 	  7.7
23 	Volkswagen Golf GTI/R   	 7,800 	   580 	  7.4
24 	Toyota Starlet 	        	61,000   4,300 	  7.0
25 	Toyota Urban Cruiser     	34,000	 2,350	  6.9

A Different Reality. But how do raw theft numbers shape up
to a car's actual theft risk? The final table below shows
you exactly how...

26 	Mercedes-Benz C-Class   	12,500 	   800 	  6.4
27 	Mahindra Pik Up 		38,000   2,200	  5.8
28 	Ford EcoSport	        	23,000 	 1,300 	  5.7
29 	Volkswagen T-Cross 		28,500	 1,600 	  5.6
30 	Hyundai Tucson 	        	11,500 	   620	  5.4
31 	Toyota Rumion 	        	18,200	   950	  5.2
32 	Nissan Magnite 			33,500 	 1,700    5.1
33	Renault Triber  		21,000 	 1,050 	  5.0
34	Suzuki Swift 			62,000 	 2,850 	  4.6
35	Renault Kiger 			22,000 	 1,000 	  4.5
36	GWM P-Series 			19,500 	   850 	  4.4
37	Kia Sonet 			27,000 	 1,100 	  4.1
38	Suzuki S-Presso 		24,000	   950	  4.0
39 	Toyota Vitz			14,500	   560	  3.9
40	Suzuki Ertiga			20,500     780 	  3.8
41 	Haval Jolion 			36,000	 1,350	  3.8
42 	Chery Tiggo 4 Pro		34,500 	 1,200 	  3.5
43	Suzuki Baleno 			19,000	   600 	  3.2
44 	Mazda CX-5 			11,800     350 	  3.0
45	Suzuki Jimny			10,200	   290 	  2.8
46 	Suzuki Fronx 			16,500	   420 	  2.5
47 	Haval H6 			16,000 	   380	  2.4
48	Chery Tiggo 7 Pro		11,500 	   260 	  2.3
49 	Honda Fit / Jazz 		 6,200 	   130 	  2.1
50 	Toyota Starlet Cross 		 7,500 	   140 	  1.9
The Side-by-Side: Perception vs. Reality
When you line up the Raw Theft position directly against the True Risk position, the sheer distortion of South African vehicle crime becomes glaringly obvious. The Hilux drops from first to seventh. The Land Cruiser 79 leaps from tenth straight to first. And the Prado jumps twenty-three places from 27th up to fourth. While the biggest winner, Suzuki Swift disappears from a top twenty fourteenth to 34th.
SOUTH AFRICAN CAR THEFT: CARS STOLEN VS THEFT RISK
Make & Model 		    Stolen    Risk   Shift
                              Rank    Rank
Toyota Land Cruiser 70 (79)	10	 1	+9
Toyota Fortuner:		 5	 2	+4
VW Polo (Hatch): 		 3	 3	 0
Toyota Land Cruiser Prado: 	27	 4     +23
Nissan NP200: Shift 		 7	 5	+2
VW Polo Vivo: Shift 		 2	 6	-4
Toyota Hilux			 1	 7	-6
Toyota HiAce Ses'fikile		 5	 8	-3
Toyota RAV4			13	 9	+4
BMW 3 Series			22	10     +12

True Risk Emerges. The real car theft risk top ten
shapes up somewhat differently to what someone wants
you to believe. But who and why?
Read the conclusion why...

Ford Ranger			 4	11	-7
Toyota Corolla Quest		23	12     +11
VW Polo Sedan			20	13	+7
Isuzu MU-X			25	14     +11
Toyota Corolla Cross		 9	15	-6
Isuzu D-Max			 8	16	-8
Hyundai Grand i10		12	17	-5
Nissan Navara			21	18	+3
Kia Picanto			15	19	-4
Hyundai i20			18	20	-2
Renault Kwid			16	21	-5
Ford Everest			31	22	+9
VW Golf GTI / R			42	23     +19
Toyota Starlet			11	24     -13
Toyota Urban Cruiser		17	25	-8

Winners & Losers: Take careful note of the wild
fluctuations on the right hand column here, between
actual car thefts versus cars stolen per number
of that model sold...

Mercedes-Benz C-Class		38	26     +12
Mahindra Pik Up			19	27	-8
Ford EcoSport			29	28	+1
VW T-Cross			26	29	-3
Hyundai Tucson			40	30     +10
Toyota Rumion			35	31	+4
Nissan Magnite			24	32	-8
Renault Triber			33	33	 0
Suzuki Swift			14	34     -20
Renault Kiger			34	35	-1
GWM P-Series			37	36	+1
Kia Sonet			32	37	-5
Suzuki S-Presso			36	38	-2
Toyota Vitz			43	39	+4
Suzuki Ertiga			39	40	-1
Haval Jolion			28	41     -13
Chery Tiggo 4 Pro		30	42     -12
Suzuki Baleno			41	43	-2
Mazda CX-5			46	44	+2
Suzuki Jimny			47	45	+2
Suzuki Fronx			44	46	-2
Haval H6			45	47	-2
Chery Tiggo 7 Pro		48	48	 0
Honda Fit / Jazz		50	49	+1
Toyota Starlet Cross		49	50	-1
Time for insurers to tell the truth?
First, the Hilux myth is busted wide open. The bakkie is heavily stolen purely because there are so many of them on the road. At a 20.1% risk ratio, its exposure is completely proportional to its massive market presence. If you want to talk real bakkie risk, talk about the Land Cruiser 79: on an index of 33.3, it is targeted by cross-border syndicates at a rate more than 65% higher than the Hilux. And you have a one in three chance of losing your 79.
Second, look at the staggering badge-engineering divide. The Toyota Starlet at an Index of 7.0. and the Suzuki Baleno with Index 3.2, are built in the exact same Indian factory, rolling on identical chassis with matching switchgear and mechanicals. Yet swapping the stylised 'S' for a ‘T’ badge more than doubles its real theft risk, purely because of Toyota's massive informal secondary parts network across SADC borders.
Finally, the Chinese boom vehicles, the Chery Tiggo 4 and Haval Jolion and Suzuki's high-flying Swift prove that sales volume alone does not trigger syndicates. Despite flooding South African roads over the past five years, all three boast theft risk indices well below 5.
In conclusion, is it time for insurance companies to drop the blanket penalties on high-volume models, look at genuine per-unit risk, and stop penalising South African car buyers for simply choosing the country's most popular cars? - Michele Lupini
*The Auto Page SA Car Theft Report is based on sales data compiled from consolidated 5-year new vehicle sales figures (2021–2025) via official Naamsa wholesale returns. Theft and hijacking volumes are modelled on aggregated annual crime releases from the South African Police Service (SAPS), cross-referenced with telematics, claims, and recovery data from vehicle tracking and intelligence specialists including Tracker, Cartrack, Fidelity Services Group, Netstar, and MiX/Powerfleet, with AI assistance. The Risk Index reflects vehicles stolen per 100 units sold over the standard ownership cycle.